
Analyze design space data easily with Multivariate Clustering techniques for efficient decision making
Written by Alessandro Viola and Mauro Munerato
27 July 2022 · 5 min read
When dealing with large amounts of data, analyzing them is a challenging task. Clustering techniques come in handy for such data analyses.
Assume you have a lot of books in your house and want to categorize them to quickly and easily discover the book you need. Obviously, randomly placing the books on the bookshelf is not as effective as you may think. You could rather organize your books by subject, by genre, by color, or by any other criterion you can think of. The book collection method is a sort of clustering: you group books according to your favorite similarity criterion. Any book in the group is a good representative of the book group.
The same could apply to simulation-driven product development where cluster analysis allows you to identify, within a complex dataset, groups of designs with similar features.
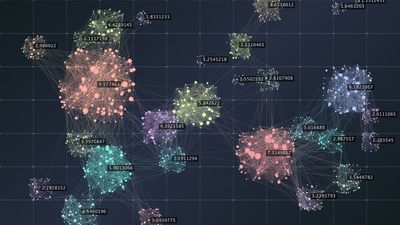
For instance, imagine if you are a CAE engineer working on a vehicle development project which requires parametric simulation and optimization techniques to achieve better design performances. It may happen that you end up having thousands of designs after an optimization run, and each design represents a possible car configuration. Manually analyzing each design is impracticable. You need an automatic way to detect the fundamental differences between them. The clustering tool is a way to do that. You only need to select the variables (to discern similarities) and a few other parameters, and the tool will do the trick. The designs will be grouped into a smaller number of clusters and you’ll only need to compare the representatives of each cluster. Once you choose the most relevant cluster for your goals, you can further examine the designs it contains.
Clustering: a multivariate analysis method to facilitate design categorization
Multivariate Analysis (MVA) refers to statistical techniques used to analyze datasets with a lot of variables and consequently identify patterns. It allows you to get a better understanding of the design space and relationships between variables before you formulate the optimization study, making the process more efficient.
Among MVA techniques (such as classification, multiple correlations analysis, and dimensionality reduction), clustering is a well-known unsupervised learning task in data mining. This technique can be intended as a pre-processing and post-processing. It means that you can cluster before the optimization (starting from the input space parameters) or you can group the designs resulting from an exploration. Both pre-processing and post-processing approaches have the purpose of reducing the amount of data you have to manage for simplifying the analysis by identifying designs that are representative of the variability of the whole dataset.
Our process automation and design optimization software, modeFRONTIER, contains a Multivariate Analysis (MVA) environment which includes a tool to perform clustering analysis. It provides users with the possibility to organize designs into groups according to a given rule (hierarchical and partitive clustering) and looks for clusters of data.
How the clustering analysis tool works in modeFRONTIER
Among other purposes, clustering can be used in modeFRONTIER to:
- Group data based on the position of each design in the input design space. The purpose of such grouping could be the training of Response Surface Models (RSMs) in different regions of the design space.
- Identify the regions of the design space in which the values of the objectives are the best. The ultimate goal is to reduce the variable space in a second step and explore this reduced area with a Design of Experiments (DOE) or an exploration algorithm.
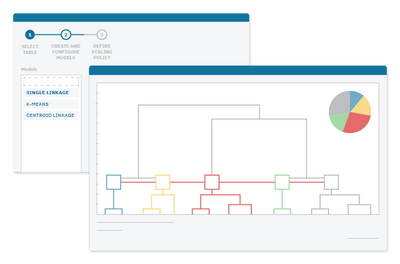
Once you have selected a dataset that you want to cluster to find groups of designs with similar properties in terms of inputs and outputs, you can run clustering models by applying several hierarchical or k-means clustering algorithms available in modeFRONTIER.
The k-means (or partitive) clustering is more suitable when you have a large dataset to cluster. In contrast to k-means, hierarchical clustering produces results that are easily visualized using a chart called dendrogram.
modeFRONTIER provides you with a single intuitive interface that unites the hierarchical and partitive clustering. This enables you to train multiple clustering models at the same time, each with a different combination of algorithms, variables, and scaling policies. After training the models, you can create a dendrogram chart for the hierarchical approaches and a DB-index chart for the partitive approaches immediately at the end of the clustering wizard.
The use of Clustering in the context of vehicle architecture trade space analysis at Hyundai
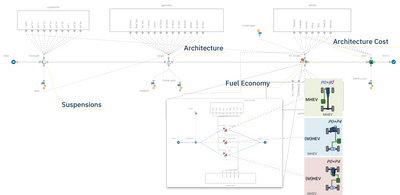
Research engineers at Hyundai Motors and Kia R&D center were looking at rapidly investigating and identifying the global optimum design region in the early stage of a vehicle design, focusing on mechanical package design, system selection, and attribute modeling. The analysis involved components such as suspensions, fuel economy, battery, and architecture costs. For this purpose, they employed modeFRONTIER to perform Trade Space Analysis (TSA) in order to identify a set of system parameters, attributes, and characteristics to satisfy the required vehicle performance during the conceptual product development phase. In practice, starting from an automated multidisciplinary modeFRONTIER workflow, they ran Design of Experiments (DOE) to evaluate all the possible vehicle configurations. Then, they applied advanced post-processing techniques such as Clustering and Multi-Criteria Decision Making (MCDM) to group similar designs and rank all reasonable alternatives on the basis of given preferences.
They initially generated 3000 different vehicle configurations based on a low fidelity model to make a decision based on a vast domain exploration.
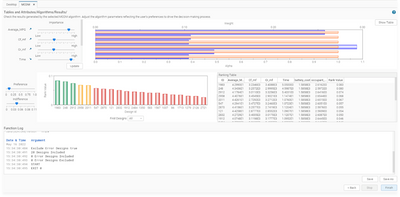
The first phase of data mining required a wise filtering phase that could reduce the dataset, maintaining its variability. Therefore, they applied the Hierarchical clustering technique to the 3000 designs considering several different requirements (fuel economy, performance, cost, and comfort) and grouped similar designs in 20 clusters.
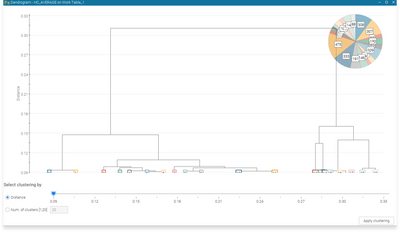
The dendrogram chart shows the 20 clusters obtained from the Hierarchical Clustering analysis
Finally, they performed an MCDM analysis on those clusters to support decision making by ranking all reasonable design alternatives on the basis of user-defined preferences. This allowed them to reject more than half of the designs immediately and to concentrate the subsequent data analysis efforts on a smaller but representative dataset.
In conclusion, with clustering methods you can make the design optimization process more efficient. You can group together multiple design samples with similar characteristics into different clusters. This allows you to reduce both the complexity of design space and the number of computations required during an exploration or optimization run.
modeFRONTIER is the leading software solution for simulation process automation and design optimization
Design better products faster
modeFRONTIER is the leading software solution for simulation process automation and design optimization
Design better products faster
modeFRONTIER is the leading software solution for simulation process automation and design optimization