
Simulation data analytics
Transform complex datasets into valuable company assets and easily identify the best design candidates.


Explore the design space with advanced engineering data analysis
Once you gather your data, whether from an optimization, a design of experiments (DOE), or direct import, managing large volumes of information can be a challenge. Our engineering data analysis tools help you turn that complexity into actionable insights to truly guide your innovation process. By combining statistical assessment of complex datasets with intuitive data visualization, you can quickly identify key performance metrics and make informed design decisions.
What is simulation data analytics?
Simulation data analytics helps engineers extract fundamental design knowledge from complex datasets. The information underlying hundreds of numerical data points generated from parametric studies or optimization campaigns is meaningless without proper interpretation. Data analytics methods — such as sensitivity analysis, statistical distribution, clustering and multi-criteria decision-making — reveal the patterns, trade-offs and relationships that show how design variables influence performance.
Advanced engineering data analytics with modeFRONTIER
The modeFRONTIER design space is packed with advanced analysis and data visualization tools.
Whether you’re comparing design alternatives, validating response surface models, or running optimization studies, it gives you a unified environment to explore, interpret, and communicate your results efficiently.

Multi-dimensional design charts
Interpret simulation data clearly. Visualize optimization trends and distributions to identify the best design candidates. Evaluate the quality of generated response surface model (RSM) functions when performing RSM-based optimization cycles.

Sensitivity analysis
Reduce problem dimensionality by excluding factors of negligible importance. By providing global correlations alongside primary and interaction effects of dependent and independent variables, you can significantly increase design evaluation efficiency.

Multi-variate analysis (MVA)
Self-organizing maps (SOM), clustering, principal component analysis (PCA) and multidimensional scaling (MDS) charts project high-dimensional data onto lower-dimensional graphs. These techniques help detect patterns, hidden structures and similarities to reveal how variable behaviour combinations impact performance.

Multi-criteria decision making (MCDM)
Provide you with graphical representation of attributes used for measuring the performance of available alternatives with respect to user preferences. The solutions are then ranked to enhance the users’ understanding of the data under consideration.
Leverage modeFRONTIER to predict designs faster
Learn moreHow our customers use simulation data analytics
Our customers navigate multiple simulation results efficiently and identify key performance metrics using our advanced engineering data analysis tools.
With VOLTA, our designers and engineers can now access simulation results in one click and collaboratively make decisions, rather than relying solely on siloed data reports.”

“modeFRONTIER managed to find a fine balance between a high number of rigorous constraints, adjusting the model geometry to the most important mechanism specifications to increase efficiency and quality while successfully integrating multiple software tools into a single workflow.”

“Despite the large amount of data, modeFRONTIER allowed us to quickly rationalize and visualize results in a smart and efficient way. The Parallel Coordinate Chart enabled us to identify the suitable prototype candidates capable of exactly matching particular cost and performance targets based on customer preferences.”

Key challenges of simulation data analytics
Managing volumes of generated data
Extracting the most relevant insights from large experimental datasets is time-consuming and prone to human error.
Overcoming dataset complexity
Transforming complex, raw simulation data into actionable insights can be difficult without specialized expertise.
Reducing design space complexity
Understanding the intricate relationships between multiple design variables is crucial for making fast, accurate engineering decisions.
Lacking accessible data-driven decision making
Analysis data is scattered across multiple locations, making it difficult to maintain a unified view of complex datasets.
Benefits of simulation data analytics
Maximizing product performance
Extract the most relevant insights from your database of experiments to optimize designs.
Reducing time to market
Eliminate redundant variables to streamline design space exploration.
Simplifying data-driven decisions
Condense complex linear and non-linear multi-dimensional data into easy-to-read charts.
Exploring what-if scenarios
Quickly assess the impact of varying input assumptions and design scenarios.
Unlocking design innovation with modeFRONTIER 2025 latest features explained

Take a deep dive into modeFRONTIER, focusing on its latest innovations for process automation and design optimization.

Leverage VOLTA for collaborative, data-driven decisions
Keep all your analysis data in one place and gain a comprehensive view of complex datasets. The VOLTA digital engineering platform allows you to stay synchronized with other experts working on your engineering problem, making it easy to compare, validate and collaboratively decide on design solutions. Our user-friendly tools for synchronized data visualization aren’t just for data analysts. You can easily share simulation actionable insights with other team members to collaboratively evaluate design changes, update models and drive the product development process forward.
- Interpret simulation data with a wide array of advanced analysis tools and web-based, 3D interactive charts.
- Enable multiple stakeholders to predict product behavior and share key insights.
- Access simulation results and manage change requests in real time.
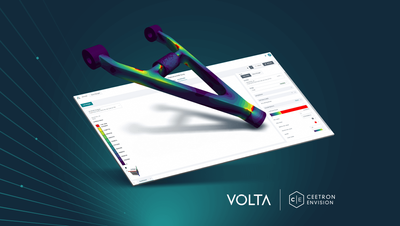
There is a general pressure to improve product performance, compress design cycles, lower weights and reduce costs. As a result, it is becoming more important than ever to have a clear and accurate understanding of the product and systems being designed. Learn more about out sofware solutions.
Get full insights into your design with 3D visualization
By leveraging advanced 3D viewer technologies — such as Techsoft 3D, VCollab and Three.js — directly in VOLTA, you can access and review 3D models from a web dashboard and share the insights in real-time with other stakeholders. There’s no need to download countless CAE data formats or manage their native solvers. You can interact with a 3D model directly in VOLTA to evaluate whether a design is viable, rather than relying solely on charts and 2D reports to make critical decisions.
Scale and democratize MDO workflows with VOLTA
Learn moreFrequently asked questions
Quick answers to questions you may have.
Simulation data analytics helps you turn complex data into clear actionable decisions through a simple step-by-step process:
- Centralize your data: store design variables, objectives, constraints, and metadata from each run in a single location using VOLTA.
- Explore relationships: use modeFRONTIER to plot variables against objectives, detect correlations, and identify non-linear behaviors between inputs and outputs.
- Identify trade-offs: visualize Pareto fronts, filter non-dominated solutions, and compare scenarios to find the best design trade-offs.
- Segment results: Apply clustering and filtering to group similar designs, filter by KPIs, and isolate promising regions of the design space.
- Track trends: Compare different studies and track KPI improvements over time across workflows.
- Build dashboards: Create interactive visualizations in VOLTA to share real-time insights with stakeholders and non-experts.
- Refine new designs: Feed your insights back into the loop to refine variable ranges, eliminate irrelevant parameters, and drive smarter DOE or optimization runs.
Yes, identifying key design drivers is one of the core benefits of simulation data analytics.
When running simulations in modeFRONTIER or managing them in VOLTA, data analytics helps you pinpoint which inputs drive your results — and which ones don’t.
With modeFRONTIER sensitivity analysis, you can:
- measure how much each variable influences the result,
- determine whether an effect is linear or complex,
- uncover hidden interactions between variables to rank them by importance.
With VOLTA, you can: - analyze data across multiple projects simultaneously,
- compare variable importance over time,
- share and reuse insights across different engineering teams to build long-term knowledge.
Visualizing high-dimensional simulation data with dozens of variables and outputs can be challenging, but simulation data analytics tools in modeFRONTIER and VOLTA offer a few practical ways to make sense of it.
- Combine scatter plots with smart filtering: scatter plots remain an essential tool when used strategically. In modeFRONTIER, you can pick two or three key variables at a time, apply filters and color points by a fourth variable. The trick is layering information rather than just plotting it.
- Use color, size, and filters to add dimensions: you can enrich existing charts. For example, use color to represent a performance metric, size to flag constraint violations, and filters to narrow down specific variable ranges.
- Leverage interactive dashboards: in VOLTA these visualizations become fully interactive. Users can explore data without changing the underlying plots.
- When objectives conflict — such as minimizing weight and maximizing strength — there’s rarely a single perfect design. Instead, simulation data analytics uses Pareo analysis to help you find the best possible compromise.
- Define your objectives: Establish what you want to minimize (cost, weight) versus what you want to maximize (performance, efficiency), while setting strict boundaries for limits (safety, temperature).
- Run DOE or optimization: use modeFRONTIER to collect enough design iterations to see how objectives interact.
- Visualize the Pareto front: plot your conflicting objectives against each other. The Pareto front shows designs where you can’t improve one performance metric without degrading another.
- Filter feasible designs: remove designs that violate constraints so you can focus on realistic options.
- Compare candidate solutions: use scatter plots, parallel coordinates to inspect each trade-off design.
- Share insights in VOLTA: store your analysis to securely manage results, compare studies, and collaborate on trade-off insights with your team.
Identifying clusters with simulation data analytics is one of the most effective ways to bring structure to large simulation datasets in modeFRONTIER and VOLTA.
Instead of looking at thousands of points, you group them into meaningful segments.
- Define similarity criteria: decide what you want to cluster. Grouping by inputs reveals similar geometries or parameters; grouping by outputs reveals similar performance profiles; combining both provides a balanced overview of your design space.
- Prepare your dataset: before clustering in modeFRONTIER remove invalid or failed runs, normalize variables, and filter to relevant designs (such as Pareto). This step ensures meaningful clusters.
- Apply a clustering method.
- Visualize the clusters
- Interpret what each cluster means
- Use clusters for decision-making. Once you understand them, you can: pick representative designs (centroids), focus optimization on promising clusters, and discard weak regions of the design space. In VOLTA, you can also: store cluster definitions, compare clusters across projects, and share insights with your team.
Yes, simulation data analytics is essential for validating simulation models. It helps you move from “the model runs” to “the model is reliable.” In modeFRONTIER and VOLTA, you can use simulation data analytics to check the accuracy, consistency, and robustness of your models.
- Compare simulation results with reference data.
- Analyze residuals and errors.
- Check sensitivity and robustness. A valid model should behave logically. Use modeFRONTIER to vary inputs slightly and observe output changes. If small input changes cause unrealistic jumps, something is wrong — smooth, consistent behavior builds trust.
- Detect anomalies and failed runs.
- Cross-validate across solvers or models.
- Validate surrogate models: compare predicted versus simulated values, check error metrics, and test on unseen data directly within the modeFRONTIER workflow.
- Track validation over time with VOLTA: store validation datasets, compare model versions, track improvements or regressions to make validation a continuous, automated process.
Yes, integrating simulation data analytics directly into your optimization workflows is highly recommended. In ESTECO tools, simulation data analytics isn’t a separate, disconnected step. It works before, during, and after optimization in modeFRONTIER, with all data managed in VOLTA.
An integrated workflow typically follows these steps:
- run an initial DOE in modeFRONTIER
- use simulation data analytics to identify key variables
- run an optimization
- use simulation data analytics to analyze Pareto fronts and trends
- refine and repeat
- store and collaborate in VOLTA
When managing large datasets, “best-performing” designs depend on your specific goals (single KPI vs. multiple objectives). Simulation data analytics helps you narrow down thousands of design points quickly in modeFRONTIER and seamlessly organize results in VOLTA.
- Constraint filtering to remove the noise.
- Use Pareto analysis for multi-objective problems. If you have multiple objectives, avoid picking a single design. Instead, automatically extract the Pareto front in modeFRONTIER and keep only non-dominated solutions. This step alone can reduce thousands of designs to a small, high-quality set.
- Rank designs for single-objective cases.
- Use visual filters to spot top regions.
- Apply clustering to group top designs.
- Define a composite score — optional but powerful.
- Save and track top designs in VOLTA. With VOLTA. Tag top-performing designs, compare across campaigns, and reuse them as benchmarks for future projects.
Experience VOLTA and modeFRONTIER software
Whether you have a question about our products, licensing options or pricing, our solution experts are here to assist you.