
From meaningless numbers to data-driven decisions in engineering product design
Written by Nela Lazarevic and Marco Turchetto
2 December 2020 · 8 min read

In the Industry 4.0 era, where self-driving cars are navigating the streets and digital twins are able to predict performance, product complexity has skyrocketed. The shift to simulation-driven design is guaranteeing faster time-to-market, with the side effects of generating more data than ever.
The biggest challenge with data today isn’t how to handle it from a technical point of view. Rather, it's about turning data into actionable insights.
The biggest challenge with data today isn’t how to handle it from a technical point of view. it's about turning data into valuable insights necessary to predict the optimal next step of the design iteration.
Having more data doesn't necessarily imply added value. No matter how detailed, the datasets deriving from simulation remain meaningless as long as they're not put into context. Data starts becoming insightful only once you start addressing it with a certain set of questions in mind aimed at discovering patterns and connections that drive your decisions.
If you’ve ever worked with massive Excel sheets you understand the difficulty of extracting useful information. Rows and columns do not have a meaning of their own. It's almost impossible to spot any relevant correlation or pattern at a first glance.
To get useful insights, simulation data must be delivered in a way that you are able to process. This is why at ESTECO we keep working to offer you powerful data management capabilities.
Pre-processing data: Filter, Highlight, Spot correlations
The first step towards data interpretation is its pre-processing by means of filters: clearing out the noise that may lead to undesirable observations, hiding parts you don't need when creating subsets for further analysis, and preparing distinct groups of data for metamodel training and validation. Similar to filters, highlights allow you to focus on a subset keeping the reference to the original dataset: designs are highlighted so that you can understand how they are positioned in the original design space.
Expression-based filters and interactive charts such as the parallel coordinate are the right tools for this challenge. The first allows you to exclude or highlight designs based on a mathematical expression or condition such as “bigger than”, “smaller than” and so forth. Parallel coordinate instead allows you to graphically screen designs directly from the chart itself and dynamically discover useful correlations.
When performing the filtering operation all charts reflect filters and highlights to let you visualize the filtered data from many different perspectives.
VOLTA Advisor
Post-processing: Enterprise-wide storytelling with data
It may come off as awkward to talk about storytelling in the realm of big manufacturing companies. But in simulation-driven design, post-processing also encompasses storytelling. The entire design process becomes an enterprise-wide collaborative task that involves people from different departments, with different expertise and roles.
Simulation experts elaborate and present the data to enable managers to make business decisions. To accommodate these different needs across the enterprise, VOLTA, a web-based collaborative environment, offers an advanced sharing system while protecting intellectual property. Stakeholders with different types of expertise are granted fine-tuned access permissions that allow or block specific actions, keeping under control who can access what, and with what level of control.
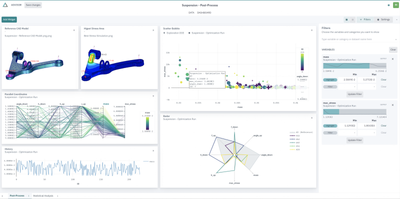
When the preprocessing is done, the second step is the visual representation of data and its analysis by means of graphic elements like charts and graphs to focus on the information that really counts. Lines, dots, and bars visually address quantitative information - trends, correlations, patterns, and outliers become visible at a glance.
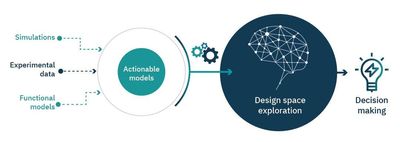
ESTECO Technology offers both charts for pure visualization of data and advanced tools that use very sophisticated algorithms to interpret the data, cluster information, and train metamodels to increase the amount of information mined from a dataset generated by the ESTECO intelligent optimization algorithms.
Even the simplest scatter bubble chart can be used to understand how data is spread in the design space, where most of the designs are grouped together, or to spot simple correlations and outliers. Other charts may be used to evaluate the evolution of the objectives throughout the entire design optimization process and understand the convergence of the strategy towards a global optimum.
But conventional methods such as Correlation or Scatter Matrix are not enough when post-processing complex datasets. Advanced methods like the Sensitivity Analysis Tool help you investigate not only the main effects but also the interactions, allowing you to fully understand even the weakest interaction among problem variables, even in the cases where the dataset is scarce and the problem is not linear.
When information is hidden in the deepest parts of the design space, advanced post-processing tools such as the Self Organizing Maps or the Principal Component Analysis come into play to help you investigate local correlations and examine the tiniest details of the dataset. Last but not least, metamodeling algorithms, commonly known as RSM, allow you to fully interpret the dataset by building on top of it a mathematical model that makes it actionable.
Beyond charts and graphs: 3D models as a bridge between the physical and virtual world
In a context where virtual models are replacing physical testing, design engineers cannot base their decisions only on static 2D charts and graphs - they need to examine the simulation data in a way that is as close as possible to the real-world experience. Like in the physical world, they need to be able to inspect and interact with the models from all angles and in real-time.
By visually exploring the structure, product, or component during the design process engineers can understand what the design looks like and get a real-world preview. Visualization, in the past dedicated mainly to CAD designs, must be extended to the entire CAE simulation to visualize the overall results of the simulation.
Industrial designers need to have a well-defined context to see what the design looks like and how it interacts with the outside world before actually producing it. Think about engineers performing structural analysis: “hot spots” should be evident at a glance. Where is the piece showing the maximum stresses? How is the piece deforming under the loading conditions?
Many of these answers can be communicated to decision-makers by using 2D images, screenshots, or pictures showing, in a fixed, non-interactive way, how the design is behaving in simulation conditions. The 2D visualizations offer a limited view since simulation data is available for a single point of view with no possibility of interacting with picture content to fully explore simulation results. Analysts have to reduce the value created by the simulation to 2D snapshots to allow decision-makers to make critical product decisions.
3D visualization of VCollab
On the other hand, 3D visualizations keep the high value of simulation throughout the entire design process up to the decision-makers. The 3D solution preserves the quality of the simulation results and allows full interaction with the simulation to inspect the tiniest details of the results.
This is why viewing 3D models is necessary when performing post-processing: to communicate, without quality loss, all details of simulation results to enable managers to make informed decisions.
VOLTA is introducing 3D web visualization in all parts of the application to empower you with powerful insights on design results by viewing your 3D CAD models and CAE simulations.
In conclusion, ESTECO technology empowers you to improve the collaboration between simulation experts and decision-makers throughout the entire design process.
Ultimately, extracting insights from simulation data translates into maximizing your investments, improving the decision-making across the enterprise, cutting development times, and producing more competitive, better-performing products.
White paper